As I spent much of my career in business intelligence and marketing, programming in R was never one of my top skills. While I started programming in R more than 30 years ago, it was never one of my core activities either. Yet I have a background in machine learning and image processing, so I am definitely used to producing high quality graphics. Even in Excel, I gained a lot of experience producing such nice plots.
To me, despite the fact (especially decades ago) that R was used mainly to produce all sorts of plots, I’ve found the images produced by R to be of poor quality, but I was too busy on other things to really care about it. Indeed, millions of plots have been generated by millions of programmers since R’s beginning (or its sister language, S+), but the majority of these plots are ugly, even some that are produced today.
I did some research to make sure the proposed fix in this article is not an obscure trick that only people with rusty programming skills would use. It turns out that my fix is widely used. It is based on the Cairo graphics library, which can be used in a variety of programming languages including Python, not just R. Its main feature (the one that attracted me) is its anti-aliasing capabilities when creating shapes such as lines or circles. Without anti-aliasing, lines (for instance) appear as broken segments, and it looks low resolution and pretty ugly: this is still the way it works today when displaying images (on your screen) produced by a command such as plot, using the default R environment.
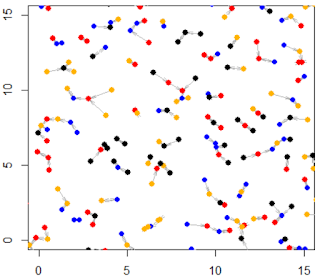
Before digging into the details, let me show you the contrast between an image with anti-aliasing, and one lacking it.
Read the full article, with solution (just two lines of code!) and fixed version of the above picture, here.


No comments:
Post a Comment
Note: Only a member of this blog may post a comment.